elasticpwn: how to collect and analyse data from exposed Elasticsearch and Kibana instances
January 02, 2022
⏳ 6 min read
Your Elasticsearch and Kibana instances are open, and that’s a real problem
I have been doing some serious research on the public exposure of Elasticsearch and Kibana instances recently, and here are a few of the reports I made, found to be valid. I’ve been enjoying it so much:
But my enjoyment must be someone else’s pain. Literally thousands of Elasticsearch and Kibana instances are publicly exposed to the Internet. They are just up for grabs, and that is a really serious problem. Sometimes, even top renowned tech companies make mistakes about this, exposing their internal data exposed to the public. The nature of the data stored in these instances are sometimes quite sensitive and are never meant to be shared: be it phone numbers, email addresses, home addresses, names, credit card numbers, even (plaintext!) passwords, internal API logs, private user data specific to the service, and more and more. I’ve seen millions of such data through this journey, which I never expected.
I honestly feel so sad for the users who have their data exposed to the public and probably don’t even know about that because it’s the developers who make mistakes, not them. I saw data from huge game studios, shopping malls, and even some of the biggest banks. It’s awful and I wanted to help fix that.
But the staggering number of instances and indices make it is somewhat difficult to find and collect interesting, or ‘useful’ data from them, which may lead to being awarded of bug bounties. To quickly gather data and filter useful and interesting ones, I decided to craft a tool that would automate removing lot of garbage data that nobody is interested in and help discover interesting data instead.
So here it is: elasticpwn.
elasticpwn: a brief overview
In this article, I will walk you through the general workflow of using elasticpwn. For the detailed explanation and full options, see README.
Prerequisites: docker-compose, go^1.17, Shodan or Binaryedge account (free account available for both)
-
Install the tool
go install github.com/9oelM/elasticpwn/elasticpwn@latest -
Get a list of URLs of publicly exposed Elasticsearch and Kibana instances from OSINT platforms like shodan.io or binaryedge.io. Here are some starter dorks:
binaryedge: find publicly exposed elasticsearch instances in the US
elasticSearch AND country:"US" AND product:"Elasticsearch REST API"shodan: find publicly exposed elasticsearch instances, excluding false positives
elasticsearch 200 -"adminer_sid" -"MiniUPnPd"Process the urls so that they are in the form of something like:
123.123.123.123:80
124.124.124.124:443
... and so on.
in a text file.
-
Launch a local mongo server (you don’t have to use mongodb, but for the sake of this tutorial, I will just use it - you can also use
jsonoutput option)curl https://raw.githubusercontent.com/9oelM/elasticpwn/main/docker-compose-mongo-only.yml -o docker-compose-mongo-only.yml && docker-compose -f docker-compose-mongo-only.yml up -d -
Run
elasticpwnto collect data from the instancesThis will collect and analyse all possible data from the instances with multiple threads.
elasticpwn elasticsearch -f list_of_elasticsearch_instances.txt -murl mongodb://root:example@172.17.0.1:27017/ -of mongo -t 12 -
Generate a report
This command will generate a directory called
/reportunder CWD.There will be a lot of data, like really a lot, and you can’t just review them all unless there is some form of review system. So there goes the reason for the existence of report feature. By default,
elasticpwnwill do its best to find interesting data like email, password, api logs, etc using its built-in regex matching and show it in addition to basic information about an instance. Based on this data, you can skip uninteresting ones and only leave interesting ones.elasticpwn report generate -cn elasticsearch -murl mongodb://root:example@172.17.0.1:27017/ -
View the report
elasticpwn report view -d ./path-to-report -p 9999
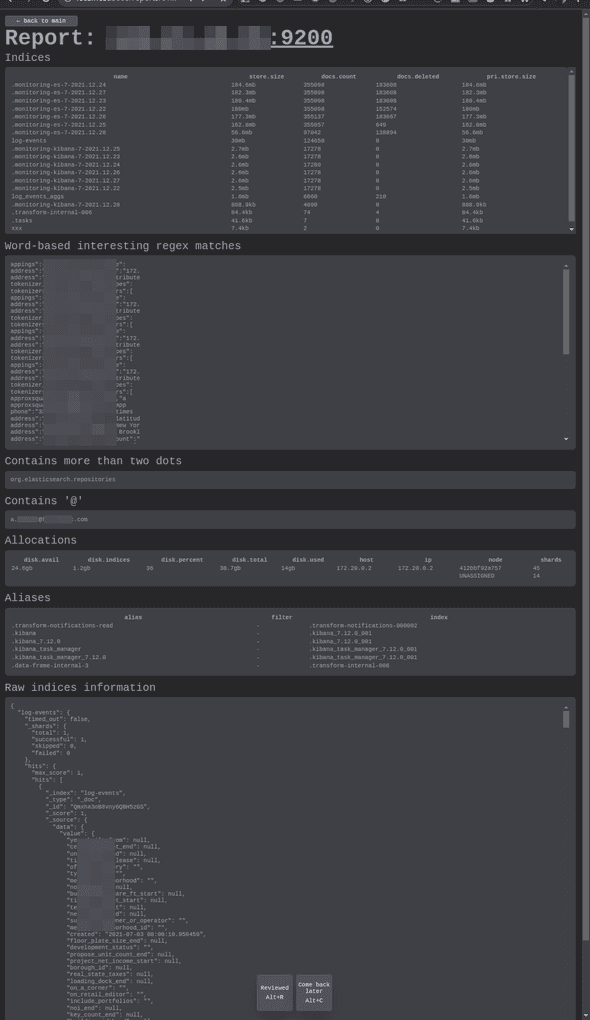
Here’s a sample report page containing information about a single Elasticsearch endpoint:
elasticpwn: persisting your research
elasticpwn also offers a way to store and retrieve the reviewed URLs, so that you don’t have to review the same URLs again with the same report page. It often becomes very confusing because some instances are quite similar and the number of the instances is just too large.
All you need is a persistent mongo database and an additional installation of elasticpwn-backend.
-
Generate the report with
-dnoption:# -dn should be the url where elasticpwn-backend will be hosted elasticpwn report generate -cn elasticsearch -murl mongodb://root:example@172.17.0.1:27017/ -dn http://localhost:9292 -
Install
elasticpwn-backend:go install github.com/9oelM/elasticpwn/report/elasticpwn-backend@latest -
Launch it. You need to specify your persistent mongodb URI as
mongodbUrioption:elasticpwn-backend -mongodbUri=mongodb+srv://username:pw@somewhere.mongodb.net/default-collection-name?retryWrites=true&w=majority -databaseCollectionName=elasticsearch_reviewed_urls -databaseName elasticpwn -port 9292 2021/12/28 05:38:54 Connected to database 2021/12/28 05:38:54 Inserting 2021/12/28 05:38:54 Test url already created before [GIN-debug] [WARNING] Creating an Engine instance with the Logger and Recovery middleware already attached. [GIN-debug] [WARNING] Running in "debug" mode. Switch to "release" mode in production. - using env: export GIN_MODE=release - using code: gin.SetMode(gin.ReleaseMode) [GIN-debug] GET /ping --> main.PingHandler (4 handlers) [GIN-debug] GET /urls --> main.GetUrlsHandlerGenerator.func1 (4 handlers) [GIN-debug] POST /urls --> main.PostUrlsHandlerGenerator.func1 (4 handlers) [GIN-debug] DELETE /urls --> main.DeleteUrlsHandlerGenerator.func1 (4 handlers) [GIN-debug] Listening and serving HTTP on 0.0.0.0:9292 -
With the server turned on, view the report (probably in another shell):
elasticpwn report view -d ./path-to-report -p 9999
Then, the report should be available, and each time you hit the ‘review’ button either with the keyboard shortcut or a click, the URL will be saved in the database for you to come back later or filter out duplicates later. If you are consistently generating report - say per week - then persistent database probably the answer.
Securing your Elastic stack
These are some really minimal steps to get your Elastic stack secured:
- set
xpack.security.enabledastrueif you are running an old version of the Elastic stack. One really good news is that this is going to betrueby default in the newest versions. This will help protect lots of instances from being exposed to the world:Currently, security features are disabled when operating on a basic or trial license when
xpack.security.enabledhas not been explicitly set to true. This behavior is now deprecated. In version 8.0.0, security features will be enabled by default for all licenses, unless explicitly disabled (by settingxpack.security.enabledtofalse). - set password:
bin/elasticsearch-setup-passwords interactive - use
WWW-Authenticateheader to restrict access - put the instances inside the private network and use VPN
- and so much more…
Elastic has a detailed documentation on security, so make sure you check it out if you are the guy who manages the Elastic stack in the company.
Conclusion
So far, we have looked at:
- the problem of data exposure from numerous Elasticsearch and Kibana instances
- how
elasticpwnhelps detect and analyse the exposed data - simple ways to secure the Elastic stack
Thank you, and your feedback is always appreciated.


